class: left, title-slide .title[ # Visualization<br><font size="5" color="black"> <a href="https://wu-rds.github.io/storytelling/">Data-based Storytelling</a></font> ] --- class: logo-small hide-footer # Data Interpretation ___ .pull-largeleft[ - Starting with Cleveland and McGill (1984) researchers have explored which types of graphs can be read accurately by humans - However, accuracy is not always the (only) goal ] .pull-smallright[ <div class="figure"> <img src="Graphics/visual_accuracy.jpeg" alt="<a href="https://www.gabrielaplucinska.com/blog/2017/8/7/pie-charts">source</a>" width="70%" /> <p class="caption"><a href="https://www.gabrielaplucinska.com/blog/2017/8/7/pie-charts">source</a></p> </div> ] --- class: hide-footer ## Focus: preattentive attributes ___ .center[ <div class="figure"> <img src="Graphics/preattent.png" alt="<a href="http://www.perceptualedge.com/articles/ie/visual_perception.pdf">source</a>" width="55%" /> <p class="caption"><a href="http://www.perceptualedge.com/articles/ie/visual_perception.pdf">source</a></p> </div> ] --- ## Focus: preattentive attributes ___ <!-- --> --- ## Focus: preattentive attributes ___ <!-- --> --- # Focus: Preattentive attributes <img src="03-Visualization_files/figure-html/plot_hl-1.png" width="80%" /> --- # Bertin's Visual Variables ___ - **Selective**: easy to distinguish categories of symbols <br> Can a group be identified? <br> e.g., red dots, blue dots but not shape - **Associative**: no difference in importance/ does not change visibility <br> Does one group seem more important? <br> e.g., red dots, blue dots - **Ordered**: Shows an ordering <br> Is there a natural ordering to the elements? <br> e.g., large dot, small dot but not shape - **Quantitative**: Can express ratios <br> large dot, small dot --- class: hide-logo-bottom # Bertin's Visual Variables ___ .center[  ] [source](https://towardsdatascience.com/the-psychology-behind-data-visualization-techniques-68ef12865720) --- class: logo-small .pull-left[ **Not Selective**  **Associative**  ] .pull-right[ **Ordered**  **Quantitative** 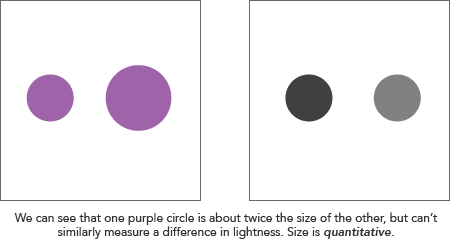 ] [source](https://www.axismaps.com/guide/visual-variables) --- # Gestalt principles .pull-left[ - Law of Proximity - Law of Closure - Law of Similarity - Law of Continuity ] .pull-right[  <br>  <br> 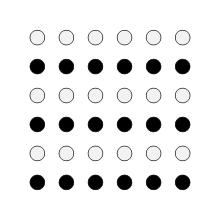 ] --- class: hide-footer # Gestalt principles: Proximity ___ .pull-left[ <!-- --> ] .pull-right[ <!-- --> ] ??? Proximity is primary grouping aesthetic --- class: hide-logo-bottom # Gestalt principles: Closure ___ .pull-left[ <!-- --> ] -- .pull-right[ <!-- --> ] --- # Gestalt principles: Similarity ___ .pull-left[ <!-- --> ] .pull-right[ <!-- --> ] --- # Gestalt principles: Continuity ___ .pull-left[ <!-- --> ] .pull-right[ <!-- --> ] --- # References ___ .scrollable[ ### Papers & Books NULL ### Links [The Psychology behind Data Visualization Techniques](https://towardsdatascience.com/the-psychology-behind-data-visualization-techniques-68ef12865720) [Adding Value with Graphics](https://www.cedricscherer.com/slides/BiB_2022_EffectiveDataCommunication.pdf) [Visual variable](http://wiki.gis.com/wiki/index.php/Visual_variable) [GIS Book](https://volaya.github.io/gis-book/en/Visualization.html) ]